There are approximately 16 million disabled people in the UK as of 2023. To put that into perspective, that’s almost 1 in 4 people living with a disability. With so many people within our population having extra accessibility needs, you would hope that most of the UK is equipped for those people – but sadly, anyone with a disability will know that often that is not the case.
With disabled individuals in mind, Surewise compared more than 60 UK cities based on 6 key metrics that consider accessibility when navigating a city, such as the number of accessible tourist attractions and hotels, to the number of public disabled toilets and parking spaces.
In order to equalise the data, we scored cities on a per 1,000 people scale to ensure that bigger cities with an expected higher number of accessible facilities did not unfairly dominate the ranking.
The data paints an interesting picture of the landscape of the UK for accessibility – raising awareness of the cities that are desperately in need of improvement and those where disabled individuals may find a stress-free travel experience.
Main Findings:
- Ely is the most accessible city in the UK, ranking highest for both the number of accessible attractions and the number of disabled parking spaces.
- Chichester, in third place, also took the top spot for two ranking factors: accessible restaurants, and number of disabled public toilets.
- Liverpool ranked best for the number of wheelchair-licensed taxis per 1,000 people, despite ranking 14th overall.
- Wells, Somerset, ranked best for the number of nearby accessible hotels available.
- Seven of the top 10 most accessible cities are based in England, two are in Scotland, and one is in Northern Ireland. No Welsh cities made it into the top 10.
- Birmingham, the second largest city in the UK, also ranked as the second-worst city for accessibility.
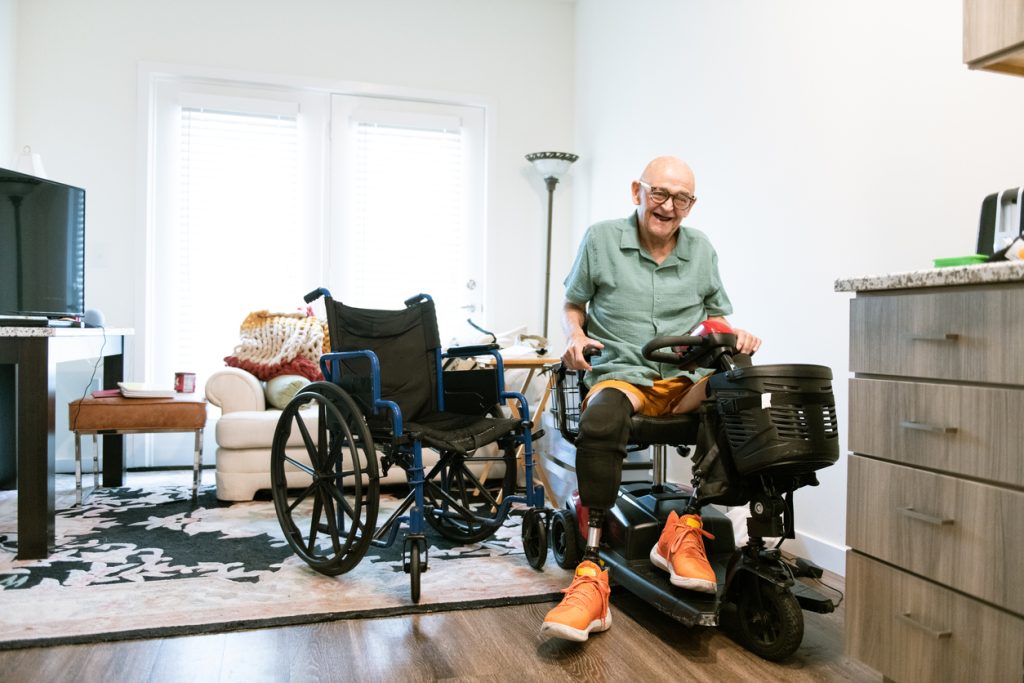
“Working with mobility scooter users and care workers on a daily basis, we know firsthand how difficult and frustrating it can be to navigate the country as a disabled person – whether making a short trip within the same city or attempting to travel across the UK.
This ranking highlights the cities that have gone above and beyond to cater to the needs of disabled individuals, making travel more seamless and stress-free. However, it also highlights just how diverse the facilities for disabled individuals can be city-by-city, with many cities leaving much room to be desired.
It’s clear that our disabled population is woefully under-served and neglected in many areas of the UK, and this is a key part of any city’s infrastructure that needs to be considered and improved moving forward.”
Most Accessible Cities in the UK:
1. Ely
Ely is one of the smaller cities on the list, with a population of just 20,256. However, Ely comes out on top for both the number of attractions within a 50-mile radius (148, or 7 per 1,000 people), and for the number of public disabled parking spaces (12, or 0.6 per 1,000 people).
The city also ranks well across the board for accessible hotels, restaurants, and attractions, giving Ely the overall title of best UK for accessibility.
2. Wells
Next up in the ranking is Wells, with a small population of just 10,536. Wells came out on top for best city for accessible hotels (29, or 3 per 1,000 people). Wells also comes fifth for the number of public disabled toilets, and third for the number of disabled parking spaces.
3. Chichester
The third best city for accessibility is Chichester, in West Sussex. The town actually scored top marks for the number of accessible restaurants in the surrounding area and for the number of public disabled toilets available.
4. Stirling
Stirling is ranked fourth overall and as the best Scottish city for accessibility. The small city, rich in historical landmarks and sites, has a population of just 34,790.
Despite this, the city performs well in this ranking due to its proximity to a number of accessible attractions and restaurants – in spite of its lower score on taxi availability and toilet facilities.
5. Dunfermline
Another Scottish city to make the top five is Dunfermline. Again, the city performed particularly well in the ranking for the number of accessible attractions and restaurants in close proximity (considering the city’s small population).
6. Lichfield
Lichfield is ranked as the sixth-best city for disabled individuals. The town ranks highly in particular the number of public disabled toilets available (25), and the number of disabled parking spots (14).
7. Lisburn
Lisburn, Northern Ireland, is ranked as the seventh most accessible UK city and the number one city for accessibility in Northern Ireland.
While the city does not have a particularly impressive number of wheelchair-accessible taxis or disabled public toilets available, it does perform well in the ranking due to the high concentration of hotels, attractions, and parking nearby.
8. Brighton
Brighton is the largest city in the top 10, with a population of approximately 273,000 people. The seaside city is well known for its diverse cultural and arts scene, and here highlights itself as a space that’s welcoming to individuals with all kinds of accessibility needs, too.
Brighton scores highly for the number of accessible toilets in the city, also ranking fourth for disabled toilet accessibility.
9. Worcester
In ninth place is Worcester, located in the West Midlands. Worcester has one the highest numbers of licensed wheelchair-accessible taxis per 1,000 people (2.04), second only to Liverpool for this ranking factor.
The city is also in the top 20 for accessible restaurants per 1,000 people and scored ninth overall for the number of accessible hotels.
10. Norwich
Norwich rounds out the top ten most accessible cities across the UK. Norwich performs particularly well in this ranking for the number of wheelchair-accessible taxis (1.44 per 1,000 people), and public disabled parking spaces, scoring ninth overall.
11. Central London
The country’s capital makes it into the top 15 best cities for accessibility, just missing out on making the top 10. As the most populous city in the UK, with a population size of approximately 1.4 million people, the city would have scored top marks across the board were we ranking cities purely on the basis of how many accessible facilities they have.
However, when calculating the number per 1,000 people, London falls several spots in comparison to others.
12. Oxford
Oxford, in central southern England, is steeped in history and takes the twelfth place for most accessible cities in the UK. Oxford scored well for the number of accessible attractions in the surrounding area, disabled parking space availability, and in the top 20 for wheelchair-accessible taxis per 1,000 people.
13. St Albans
St Albans scored among the highest for the number of accessible restaurants per 1,000 people (with a total of approximately 1,349 accessible restaurants in the city!). The city also scored well for accessible hotels in the area.
14. Liverpool
Liverpool, despite coming in 14th place overall, ranked highest for the number of wheelchair-accessible taxis per 1,000 people out of all other cities in this index.
15. Cambridge
Cambridge has a moderate population of approximately 123,867 people and ranked impressively well in this index for the number of accessible restaurants in close proximity to the area.
Accessibility by Country
England’s Most Accessible City: The most accessible city in England is also the most accessible city overall: the small town of Ely, located in Cambridgeshire with a total score of 363.58 (out of a possible 600).
Wales’s Most Accessible City: The highest-ranking Welsh city for accessibility is Wrexham which ranked 20th overall with a total score of 97.65.
Scotland’s Most Accessible City: The most accessible city in Scotland is Stirling, which ranked fourth overall with 253.43 points.
Northern Ireland’s Most Accessible City: Northern Ireland’s most accessible city is Lisburn ranked eighth overall with a total score of 154.01.
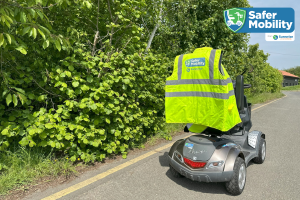
Mobility Insurance
Cover includes:
- Theft, Vandalism & Accidental Damage
- Third Party Liability & Legal Expenses
- Multiple Riders & No Age Limit
- No Hidden Fees & No Excess
UK’s Least Accessible Cities
Of course, at the other end of the spectrum, there are the cities that did not rank as well. The cities labelled as the worst cities for accessibility here were:
- Exeter
- Birmingham
- Derry
- Leeds
- Bradford
Exeter ranked as the worst UK city for accessibility overall, with a score of just 27.22 out of a possible 600. The moderately sized city, with a population of approximately 127,000, scored particularly poorly for the number of accessible attractions nearby, accessible restaurants, and accessible hotels.
Birmingham, the second largest city in the UK, ranked as the second-worst city for accessibility. With a population of approximately 1 million people, the city performed poorly for the number of accessible facilities per 1,000 people with low scores almost across the board.
Accessibility Statistics in the UK
- There are an estimated 16 million (24%) disabled people in the UK
- There are approximately 10.4 million disabled people in England and Wales (17.8% of the population)
- 25.4% of households (6 million) in England include one disabled member
- 6.6% of households (1.6 million) in England have two or more disabled people living there
- 29.5% of households in Wales (397,000) have 1 disabled member
- Regionally, the North East has the highest percentage of disabled people with 29%, followed by the North West (28%)
- London has the lowest percentage of disabled people (17%)
Sources:
Department for Work & Pensions (DWP), released 23 March 2023, GOV.UK website, statistical release, Family Resources Survey: financial year 2021 to 2022. Office for National Statistics (ONS), released 19 January 2023, ONS website, statistical bulletin, Disability, England and Wales: Census 2021
Ranked: The Most Accessible Cities in the UK
| Ranking | UK City | Overall Score | Hotels | Attractions | Restaurants | Parking | Toilets | Licensed Wheelchair Accessible Taxis |
| 1 | Ely | 363.58 | 0.84 | 7.31 | 12.49 | 0.59 | 0.49 | 0.1 |
| 2 | Wells | 316.98 | 2.75 | 5.41 | 5.22 | 0.38 | 0.38 | 0.2 |
| 3 | Chichester | 285.13 | 0.67 | 0.11 | 15.71 | 0.30 | 0.97 | 0.26 |
| 4 | Stirling | 253.43 | 0.63 | 6.12 | 5.86 | 0.37 | 0.11 | 1.01 |
| 5 | Dunfermline | 221.19 | 1.79 | 4.04 | 3.76 | 0.14 | 0.18 | 1.01 |
| 6 | Lichfield | 219.62 | 0.47 | 0.03 | 7.54 | 0.43 | 0.78 | 0.03 |
| 7 | Lisburn | 154.01 | 1.15 | 2.45 | 2.64 | 0.29 | 0.07 | 0.20 |
| 8 | Brighton | 148.02 | 0.06 | 0.07 | 2.44 | 0.30 | 0.43 | 1.0 |
| 9 | Worcester | 125.61 | 0.36 | 1.03 | 2.39 | 0.03 | 0.08 | 2.04 |
| 10 | Norwich | 123.89 | 0.14 | 0.32 | 0.56 | 0.23 | 0.23 | 1.44 |
| 11 | Central london | 123.16 | 0.19 | 0.82 | 0.81 | 0.20 | 0.08 | 1.7 |
| 12 | Oxford | 118.81 | 0.07 | 1.54 | 2.15 | 0.27 | 0.13 | 0.66 |
| 13 | St Albans | 114.78 | 0.51 | 0.14 | 9.59 | 0.08 | 0.05 | 0.44 |
| 14 | Liverpool | 113.18 | 0.08 | 0.14 | 0.03 | 0.02 | 0.05 | 2.93 |
| 15 | Cambridge | 112.63 | 0.15 | 0.15 | 6.89 | 0.10 | 0.12 | 0.91 |
| 16 | Preston | 105.40 | 0.05 | 1.47 | 2.58 | 0.11 | 0.06 | 1.26 |
| 17 | Edinburgh | 98.80 | 0.14 | 0.42 | 0.38 | 0.20 | 0.17 | 1.01 |
| 18 | Wrexham | 97.65 | 0.60 | 1.83 | 3.41 | 0.03 | 0.16 | 0.20 |
| 19 | Bangor, NI | 96.79 | 0.72 | 1.80 | 1.93 | 0.10 | 0.10 | 0.20 |
| 20 | Chelmsford | 95.19 | 0.18 | 0.11 | 7.04 | 0.14 | 0.04 | 0.45 |
| 21 | Bath | 90.77 | 0.17 | 0.65 | 0.75 | 0.27 | 0.23 | 0.1 |
| 22 | Chester | 89.69 | 0.20 | 1.84 | 3.10 | 0.03 | 0.07 | 0.7 |
| 23 | Milton Keynes | 86.00 | 0.28 | 0.11 | 1.82 | 0.21 | 0.12 | 0.44 |
| 24 | Hereford | 85.52 | 0.12 | 2.34 | 3.68 | 0.10 | 0.02 | 0.2 |
| 25 | Coventry | 84.31 | 0.31 | 0.38 | 0.90 | 0.04 | 0.08 | 1.40 |
| 26 | Manchester | 84.06 | 0.10 | 0.00 | 0.03 | 0.02 | 0.10 | 1.96 |
| 27 | Glasgow | 81.49 | 0.06 | 0.30 | 0.26 | 0.21 | 0.04 | 1.01 |
| 28 | Newport | 80.68 | 0.15 | 0.28 | 0.52 | 0.15 | 0.25 | 0.5 |
| 29 | Doncaster | 80.24 | 0.08 | 0.42 | 3.25 | 0.17 | 0.02 | 0.58 |
| 30 | Winchester | 79.03 | 0.43 | 0.03 | 3.22 | 0.06 | 0.21 | 0.33 |
| 31 | Southend-on-Sea | 74.28 | 0.11 | 0.03 | 0.75 | 0.24 | 0.07 | 0.51 |
| 32 | Nottingham | 73.02 | 0.03 | 0.55 | 1.30 | 0.13 | 0.07 | 0.77 |
| 33 | Newcastle | 70.24 | 0.05 | 0.08 | 0.19 | 0.13 | 0.13 | 0.9 |
| 34 | Gloucester | 69.73 | 0.23 | 1.27 | 2.44 | 0.12 | 0.07 | 0.07 |
| 35 | Plymouth | 65.79 | 0.03 | 0.09 | 0.18 | 0.13 | 0.06 | 1.02 |
| 36 | Canterbury | 65.51 | 0.05 | 1.40 | 2.08 | 0.11 | 0.07 | 0.16 |
| 37 | Cardiff | 62.85 | 0.05 | 0.16 | 0.11 | 0.03 | 0.02 | 1.5 |
| 38 | Derby | 61.30 | 0.07 | 0.74 | 1.36 | 0.07 | 0.04 | 0.69 |
| 39 | Inverness | 61.24 | 0.21 | 0.16 | 0.14 | 0.03 | 0.11 | 1.01 |
| 40 | Bristol | 59.46 | 0.09 | 0.13 | 0.13 | 0.08 | 0.15 | 0.7 |
| 41 | Dundee | 56.74 | 0.10 | 0.48 | 0.45 | 0.05 | 0.01 | 1.01 |
| 42 | Leicester | 54.77 | 0.29 | 0.14 | 0.75 | 0.08 | 0.06 | 0.54 |
| 43 | Southampton | 54.63 | 0.04 | 0.40 | 1.31 | 0.05 | 0.21 | 0.29 |
| 44 | Lincoln | 51.73 | 0.11 | 0.00 | 0.06 | 0.20 | 0.03 | 0.29 |
| 45 | Colchester | 51.04 | 0.11 | 0.04 | 3.18 | 0.10 | 0.05 | 0.15 |
| 46 | Lancaster | 50.70 | 0.03 | 1.10 | 2.07 | 0.08 | 0.04 | 0.10 |
| 47 | Portsmouth | 50.05 | 0.05 | 0.09 | 0.20 | 0.15 | 0.11 | 0.25 |
| 48 | Sheffield | 50.00 | 0.03 | 0.33 | 0.76 | 0.02 | 0.05 | 0.91 |
| 49 | Peterborough | 45.89 | 0.06 | 0.64 | 1.22 | 0.04 | 0.03 | 0.50 |
| 50 | Swansea | 45.67 | 0.04 | 0.00 | 0.01 | 0.04 | 0.01 | 1.1 |
| 51 | Salford | 44.63 | 0.04 | 1.24 | 2.26 | 0.00 | 0.01 | 0.31 |
| 52 | Wolverhampton | 44.07 | 0.03 | 0.49 | 1.16 | 0.02 | 0.06 | 0.58 |
| 53 | Stoke-on-Trent | 42.98 | 0.09 | 1.03 | 1.95 | 0.03 | 0.01 | 0.22 |
| 54 | Sunderland | 42.24 | 0.03 | 0.05 | 1.42 | 0.03 | 0.07 | 0.58 |
| 55 | Aberdeen | 39.87 | 0.11 | 0.01 | 0.03 | 0.00 | 0.00 | 1.01 |
| 56 | Belfast | 39.25 | 0.12 | 0.33 | 0.30 | 0.08 | 0.08 | 0.20 |
| 57 | Kingston upon Hull | 38.76 | 0.07 | 0.00 | 0.44 | 0.02 | 0.09 | 0.6 |
| 58 | York | 36.94 | 0.06 | 0.73 | 1.35 | 0.03 | 0.04 | 0.22 |
| 59 | Durham | 36.01 | 0.11 | 0.57 | 1.00 | 0.05 | 0.05 | 0.1 |
| 60 | Wakefield | 32.54 | 0.21 | 0.51 | 1.08 | 0.04 | 0.01 | 0.08 |
| 61 | Bradford | 30.30 | 0.12 | 0.38 | 0.58 | 0.00 | 0.04 | 0.39 |
| 62 | Leeds | 27.99 | 0.02 | 0.21 | 0.45 | 0.03 | 0.04 | 0.34 |
| 63 | Derry | 27.86 | 0.11 | 0.07 | 0.10 | 0.00 | 0.15 | 0.20 |
| 64 | Birmingham | 27.36 | 0.05 | 0.10 | 0.23 | 0.01 | 0.01 | 0.57 |
| 65 | Exeter | 27.22 | 0.08 | 0.15 | 0.41 | 0.03 | 0.04 | 0.31 |
*Ranking factors are displayed on a per 1,000-person basis calculated according to each city’s population.
Methodology
In order to determine which cities in the UK are the best for accessibility accommodations, Surewise compared 66 UK cities across six key metrics:
- Hotels with disabled facilities
- Accessible tourist attractions within a 50-mile radius
- Accessible restaurants within a 50-mile radius
- Number of public disabled toilet facilities
- Number of public disabled parking spaces
- Number of wheelchair-accessible licensed taxis
Once we gathered this data, we then calculated each metric based on the number per 1,000 people to ensure all cities were fairly evaluated. This was done by the following equation:
(number of X ranking factor – city population size)*1000.
We then scored each city for each ranking metric on a 100-point scale and used these scores to calculate an overall score for a total of 600 points. All ranking factors were given an equal weight in this ranking.
Sources: Data used to create this ranking were collected from AccessAble.co.uk, Booking.com, ToiletMap, BlueBadgeParking, and ONS Data. For the Scotland and Northern Ireland wheelchair-accessible taxi information, which is not publically available, a country average was calculated for all cities from the BBC and Transport Scotland. City population figures were gathered from ONS Census Data.